


Tutorials – UE3 Performance Profiling Introduction
About : Basic introduction to performance profiling.
Target Audience : Intermediate and above.
Platform : Unreal Engine 3
Last Update : November 2011
The Basics
There are a couple of great pages about game profiling on UDN, but as those are quite programmer focused and simply plain “too much” I decided to write a bit easier and more basic guide to profiling in Unreal.
Profiling means to find out exactly what part of the game is causing performance issues. Is it the lighting? The particles? The code? And so on. Before you can get to solving your performance problems you first need to know what exactly is causing it.
It is best to do your profiling in the real game, and not in the editor PIE/Play-In-Editor game, as having the editor running in the background can have a significant impact on performance. Some parts of the game are more sensitive to whether or not you have the editor running in the background to my experience. Physics for example. When I made The Ball we often encountered situations where the physics behaved differently and less accurate in the PIE game.
Be sure to run your game with the following command line options set:
For example:
H:\UDK\UDK-2011-09\Binaries\Win64\UDK.exe -log -remotecontrol -windowed -NoVSync
Run your game, open the console, and type:
Stat fps displays the framerate and milliseconds a frame. Stat unit displays the milliseconds per component. The milliseconds are how long it takes the computer to render a single frame.
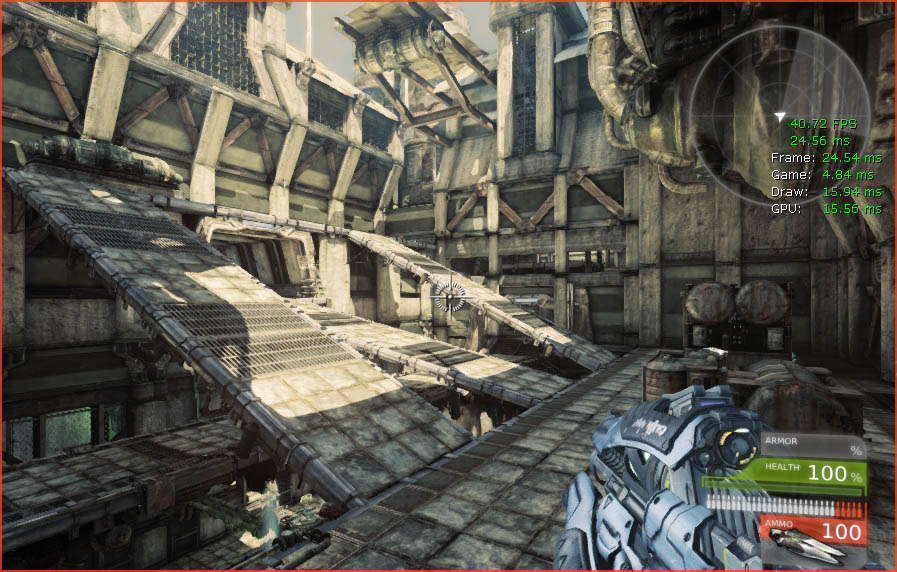
So in this example we can see that we have 40.72 frames per second (FPS), and 24.56 milliseconds per frame (ms). Since one second is 1000 milliseconds long, that means that 1000 ms / 24.56 ms gets us 40.72 frames rendered that second. So the longer a single frame (=image) takes to render, the fewer frames will fit within this 1000 millisecond window (=one second) and thus the lower the framerate will be. Therefore, the millisecond value is what it is all about.
Stat unit gives allows you to see which component is taking the most time per frame to process.
In the example the GPU is more stressed than the CPU, which is usually the case as the rendering is often the part that is most complex to do for the hardware.
It should also be noted that the time it takes in milliseconds differs from PC to PC. It is hardware dependent. A more powerful GPU requires less time to render something, and a powerful CPU requires less time to go through some code. A high CPU ms value does not necessarily mean that something is wrong in your game, it may also simply be that your 3D card is much more powerful than your CPU and that your CPU has trouble keeping up with the pace.
More Stat Commands
In the third tab of the Remote Control window you can find a long list of statistics to display. Lets go over some of the most common ones. You can also trigger all of these by typing them directly into the console.
Stat SceneRendering
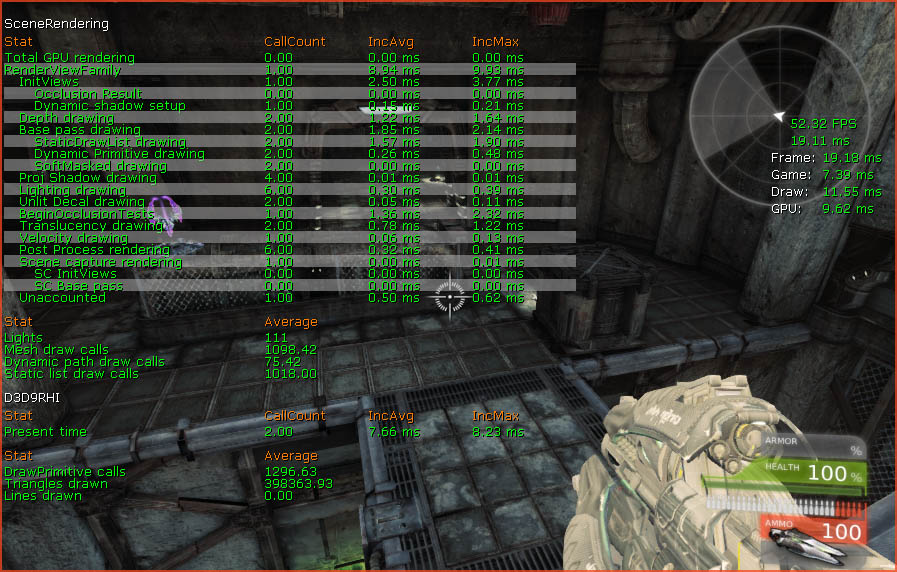
These are statistics to do with the rendering of the scene. Look for any statistic that takes an usual large amount of time to process.
Within SceneRendering I often focus on the following values:
Stat D3D9RHI or Stat D3D11RHI
Shown at the bottom of the previous screenshot. The D3D stats display information from the render device. D3D9RHI if you are using DirectX9, D3D11RHI if you are using DirectX11.
Some very important values here:
Stat ES2
This command is the iOS equivalent of Stat D3D9RHI. It outputs information from the iOS render device.
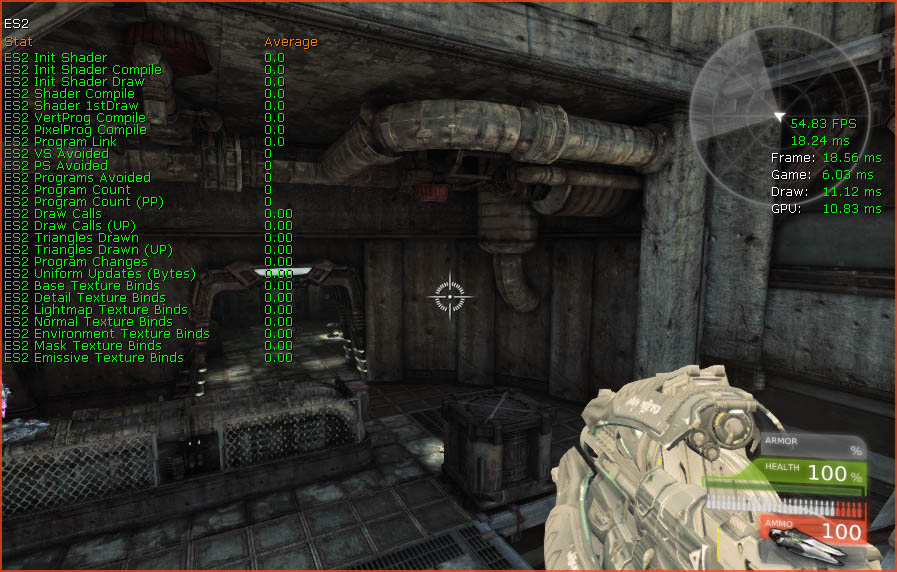
As this screenshot was taken from within a regular PC game all values are 0. This command will only work when used on a iOS device. Like Stat D3D9RHI, Stat ES2 exposes the Draw Calls and Triangles Drawn to you.
Stat InitViews
Handles Occlusion calculation. What mesh can or cannot be seen currently? The engine and the hardware have to continuously check which objects can or cannot be seen, and that can quickly get out of hand, especially on weaker hardware such as iOS devices.
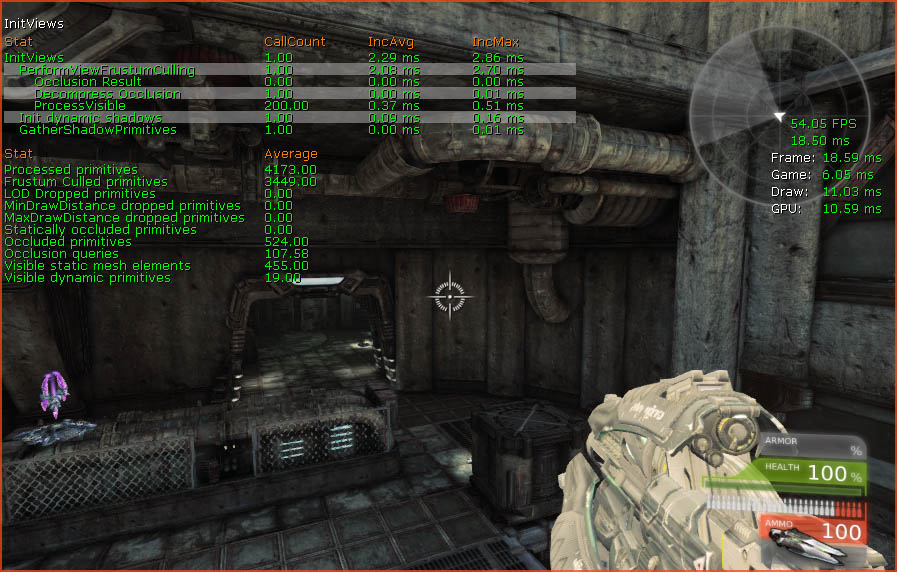
Of particular importance:
Stat Collision
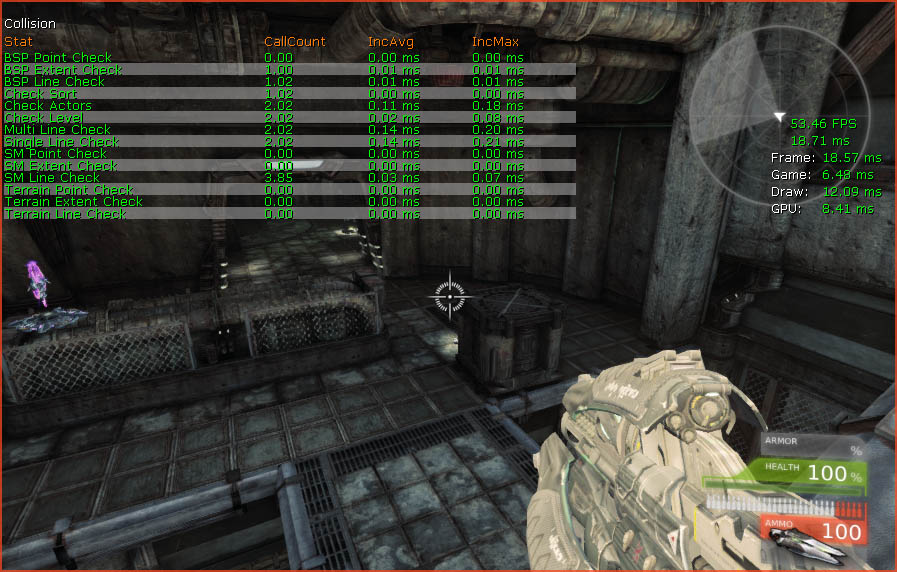
Should be especially checked when working with a physics/vehicle intensive game and/or weak hardware.
Stat Memory
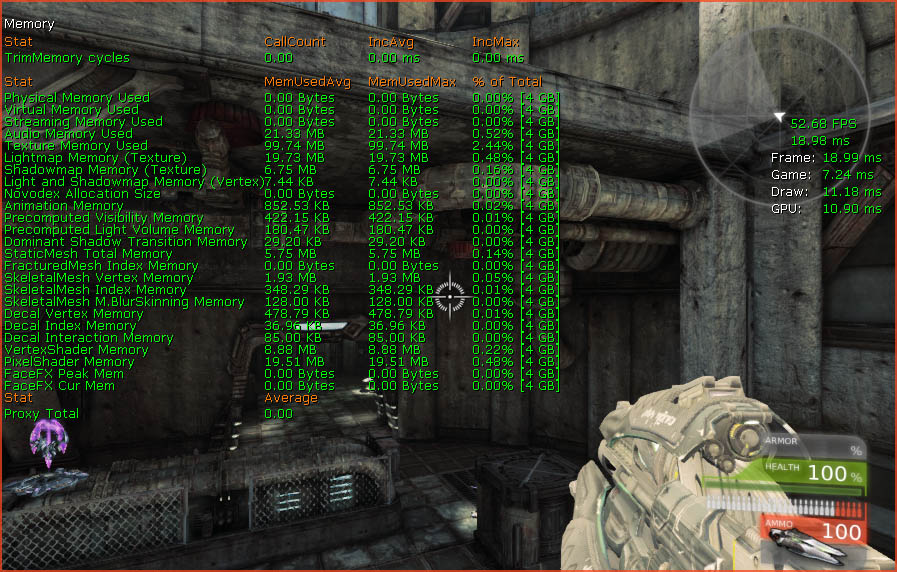
The memory taken by the various parts of the game. How high things can be depend entirely on your target device/platform.
Stat StatSystem
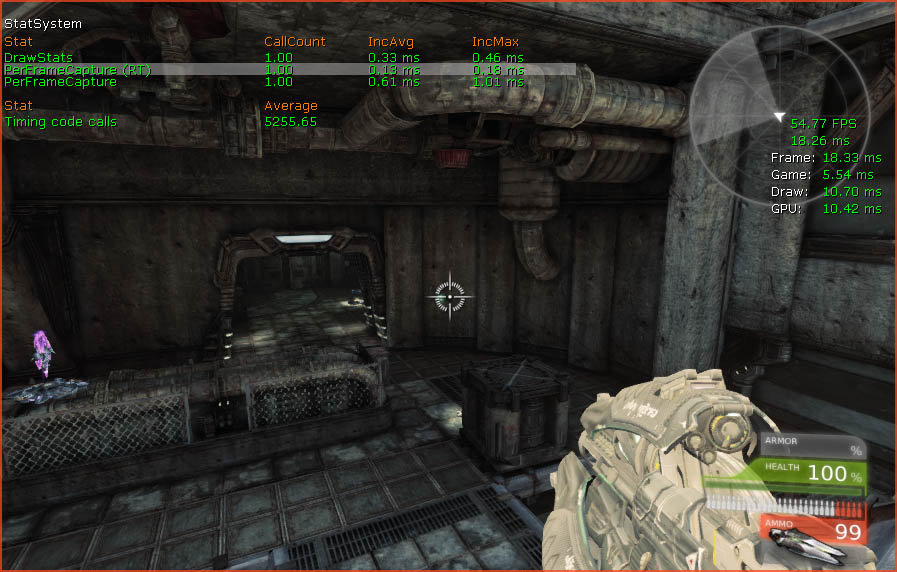
Rendering statistics in itself takes performance, Stat StatSystem shows you just how much. When accessing the framerate it is important to have as many stats turned off as possible.
Stat Engine
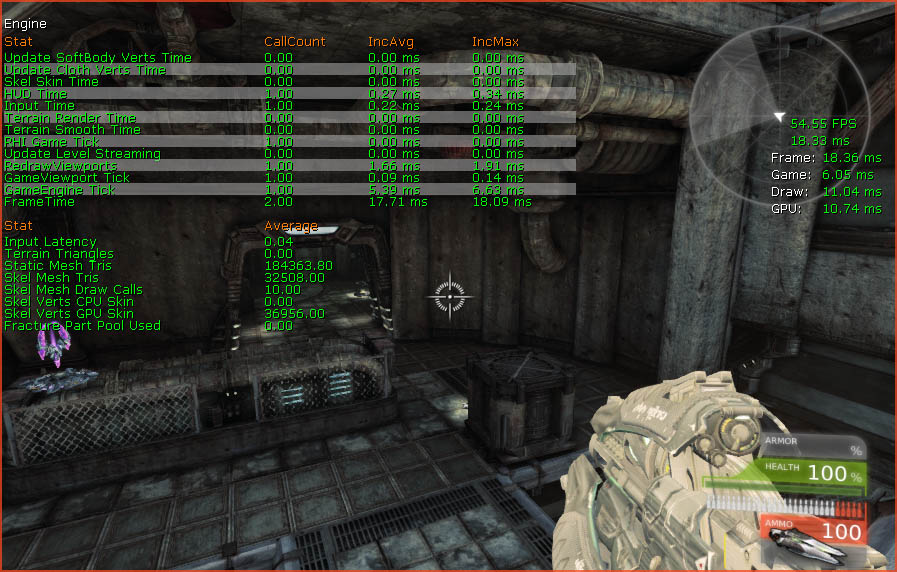
Of particular important:
Stat Game
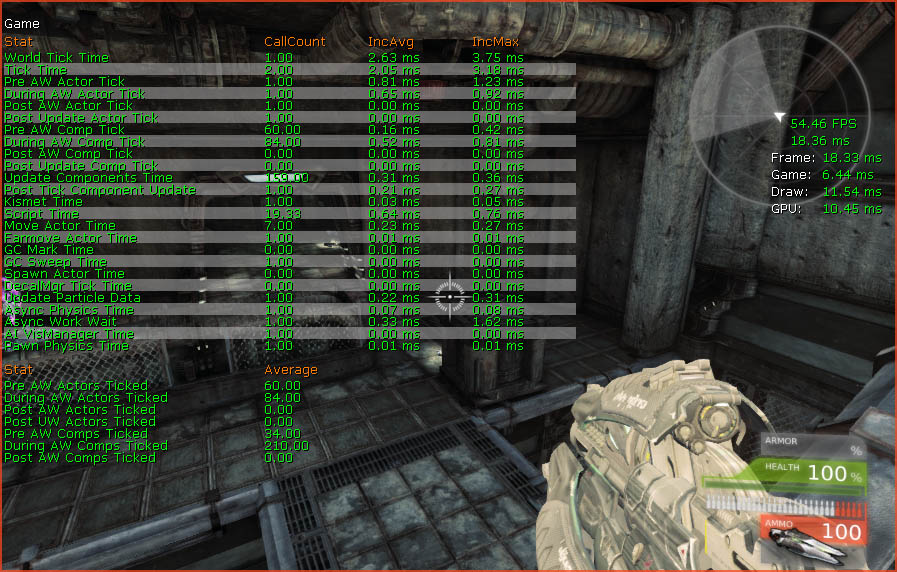
These are all values that have something to do with the processing of UnrealScript and Kismet.